Unit 7 - Lesson 3
3/1/2024 9:30:00 PM

The population _____ shows that many countries are becoming older because of low birth rates.
- trend
- density
- expansion
- policy
The number of elderly people is growing _____ as life expectancy rises.
- temporarily
- accidentally
- reluctantly
- significantly
The size of the working-age population can _____ with changes in education and retirement policies.
- deal
- construct
- fluctuate
- stabilize
Choose the word(s) OPPOSITE in meaning to the underlined word(s).
The demand for public transport has grown significantly due to the significant rise in city populations.
- predictable
- unimportant
- massive
- gradual
Choose the word(s) CLOSEST in meaning to the underlined word(s).
The number of people living in the city center has decreased slightly as families move to the suburbs.
- rapidly
- suddenly
- a little
- a lot
Drag and drop to complete the sentences.
1. The city’s population showed a increase, so many people worried about overcrowding and housing shortages.
2. The city’s population showed a increase from 2.01 million to 2.05 million between 2015 and 2020.
3. The population showed a increase, which people considered positive because it was predictable and manageable.
Complete the sentence by changing the form of the word in capitals.
The amount of green space in the city has decreased as more buildings are built. (SHARP)
Complete the sentence by changing the form of the word in capitals.
Seasonal in city populations happens when students leave for summer holidays. (FLUCTUATE)
Complete the sentence by changing the form of the word in capitals.
Public transport use is climbing as more residents prefer buses and trains over private vehicles. (STEADY)


Listen to Mr. Evans talking about Glenfield. Choose the correct answer.
What was the approximate population of Glenfield in the year 2000?
- 800,000
- 180,000
- 890,000
Which of the following infrastructure improvements has the city council NOT done over the past 25 years?
- Constructing a new water treatment facility
- Developing a bus network
- Creating several new shopping centers
What is the major problem in Glenfield according to Mr. Evans?
- Pressure on resources
- Lack of schools and hospitals
- High crime rates
What is a direct consequence of the predicted 70% increase in demand on the power grid?
- A major increase in electricity costs
- A significant risk of blackouts
- The need to build more community centers
What is the purpose of creating a light-rail system?
- To connect Glenfield with other cities
- To make commuting cheaper
- To reduce both traffic and pollution
Read the following passage and choose the correct answer to each of the questions.
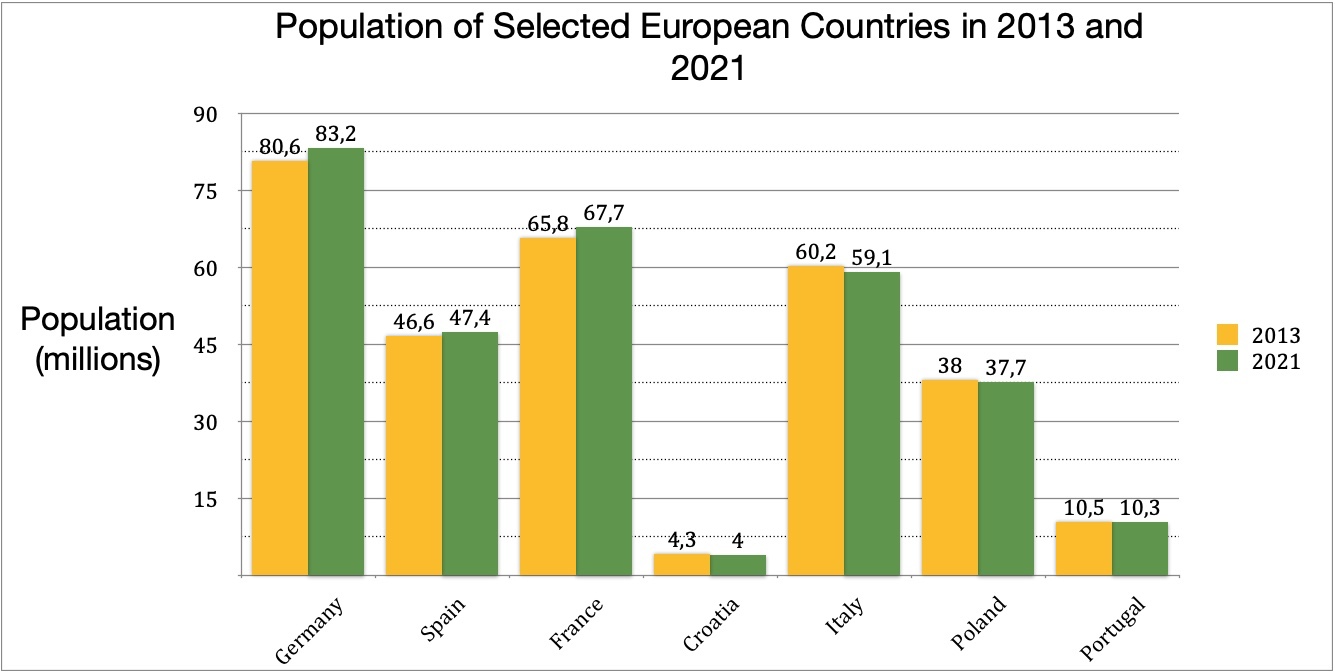
The chart shows the population changes of seven selected European countries between 2013 and 2021. These countries are Germany, Spain, France, Croatia, Italy, Poland, and Portugal.
In general, most countries experienced population changes during this 8-year period, though the patterns varied significantly. Germany demonstrated the most substantial population growth, while some countries saw their populations decline. The changes ranged from significant increases to notable decreases across different nations.
Germany had the most remarkable population change during this period. Its population rose from 80.6 million in 2013 to 83.2 million in 2021, representing an increase of approximately 2.6 million people. France also experienced steady growth, with its population expanding from 65.8 million to 67.7 million, an increase of nearly 2 million people over the 8-year span. Spain showed a different pattern, with its population remaining relatively stable. It had 46.6 million people in 2013 and experienced only a slight increase to 47.4 million by 2021.
In contrast, several countries experienced population decreases. Italy's population fell from 60.2 million in 2013 to 59.1 million in 2021, a decline of approximately 1.1 million people. Poland saw its population decrease from 38.0 million to 37.7 million. Similarly, Croatia maintained a fairly stable population, going from 4.3 million to 4.0 million, showing a minor decline. Portugal had the smallest population among the countries shown, dropping slightly from 10.5 million in 2013 to 10.3 million in 2021.
What can be inferred from the passage?
- Germany is the largest country in Europe by land area.
- All countries in the chart saw significant changes in their population.
- Smaller countries were more likely to see a population decline.
- Population trends among the selected European countries were not consistent.
According to the passage, the population of Germany _____.
- increased by 83.2 million by 2021
- increased to 83.2 million by 2021
- increased by 80.6 million by 2021
- increased to 2.6 million by 2021
The word "expanding" in paragraph 3 is CLOSEST in meaning to ____
- shrinking
- stabilizing
- increasing
- stopping
Which of the following is NOT true about Italy's population?
- It increased by approximately 1.1 million people.
- It experienced a decline of about 1.1 million people.
- It was over 60 million in 2013.
- It was 59.1 million in 2021.
Between 2013 and 2021, Portugal's population _____.
- decreased by 10.5 million
- decreased by 10.3 million
- increased by 0.2 million
- decreased by 0.2 million
Read about writing reports on bar charts, then write "I" for introduction, "O" for overview, and "B" for body on the lines below.
| 1. The chart compares population data for three cities (Tokyo, London, and Cairo) in 1990 and 2020. | |
| 2. Overall, all three cities saw an increase in their number of residents over the 30-year period. | |
| 3. The population of London grew from 6.5 million to nearly 8 million people. | |
| 4. It is clear that Tokyo was the most populous city in both years by a significant margin. | |
| 5. The information shows how the number of inhabitants changed in three urban centers across three decades. | |
| 6. Cairo's population expanded significantly, rising from 9 million in 1990 to over 14 million in 2020. | |
| 7. The most dramatic growth, in relative terms, was experienced by Cairo. |
Write a report (180-200 words) about the information in the bar chart. Summarize the information by selecting and reporting the main features, and make comparisons.